Explainer
September 8, 2024
Satellites and steel decarbonisation
How we're using satellite imagery to assess the steel sector's progress on decarbonisation

Summary
Steel production is critical to our global economy, but the industry is a major source of greenhouse gas emissions
Today, sector data is sparse and inaccurate, distorting our understanding of global emissions
Satellite imagery can bridge some data gaps by tracking heat signatures from steel plants
We’ve compiled a global, open-access dataset of steel plants and their sub-assets: blast furnaces, coke oven batteries, sinter and pellet plants. Combined with heat signature data, we can estimate production and emissions at facility level
Download the dataset now and learn more about the limitations of using satellite data to make estimates about steel’s contribution to climate change
A critical, but dirty, industry
Steel plays a vital role in everyday life. We use steel to build our homes, hospitals, bridges, vehicles, and kitchen pans. Steel is a critical ingredient for the energy transition. Without steel, we cannot create the solar panels, wind turbines, dams, and electric vehicles we’ll need to reach net zero emissions.
The IEA projects that the demand for this indispensable material will keep rising over the coming decades.
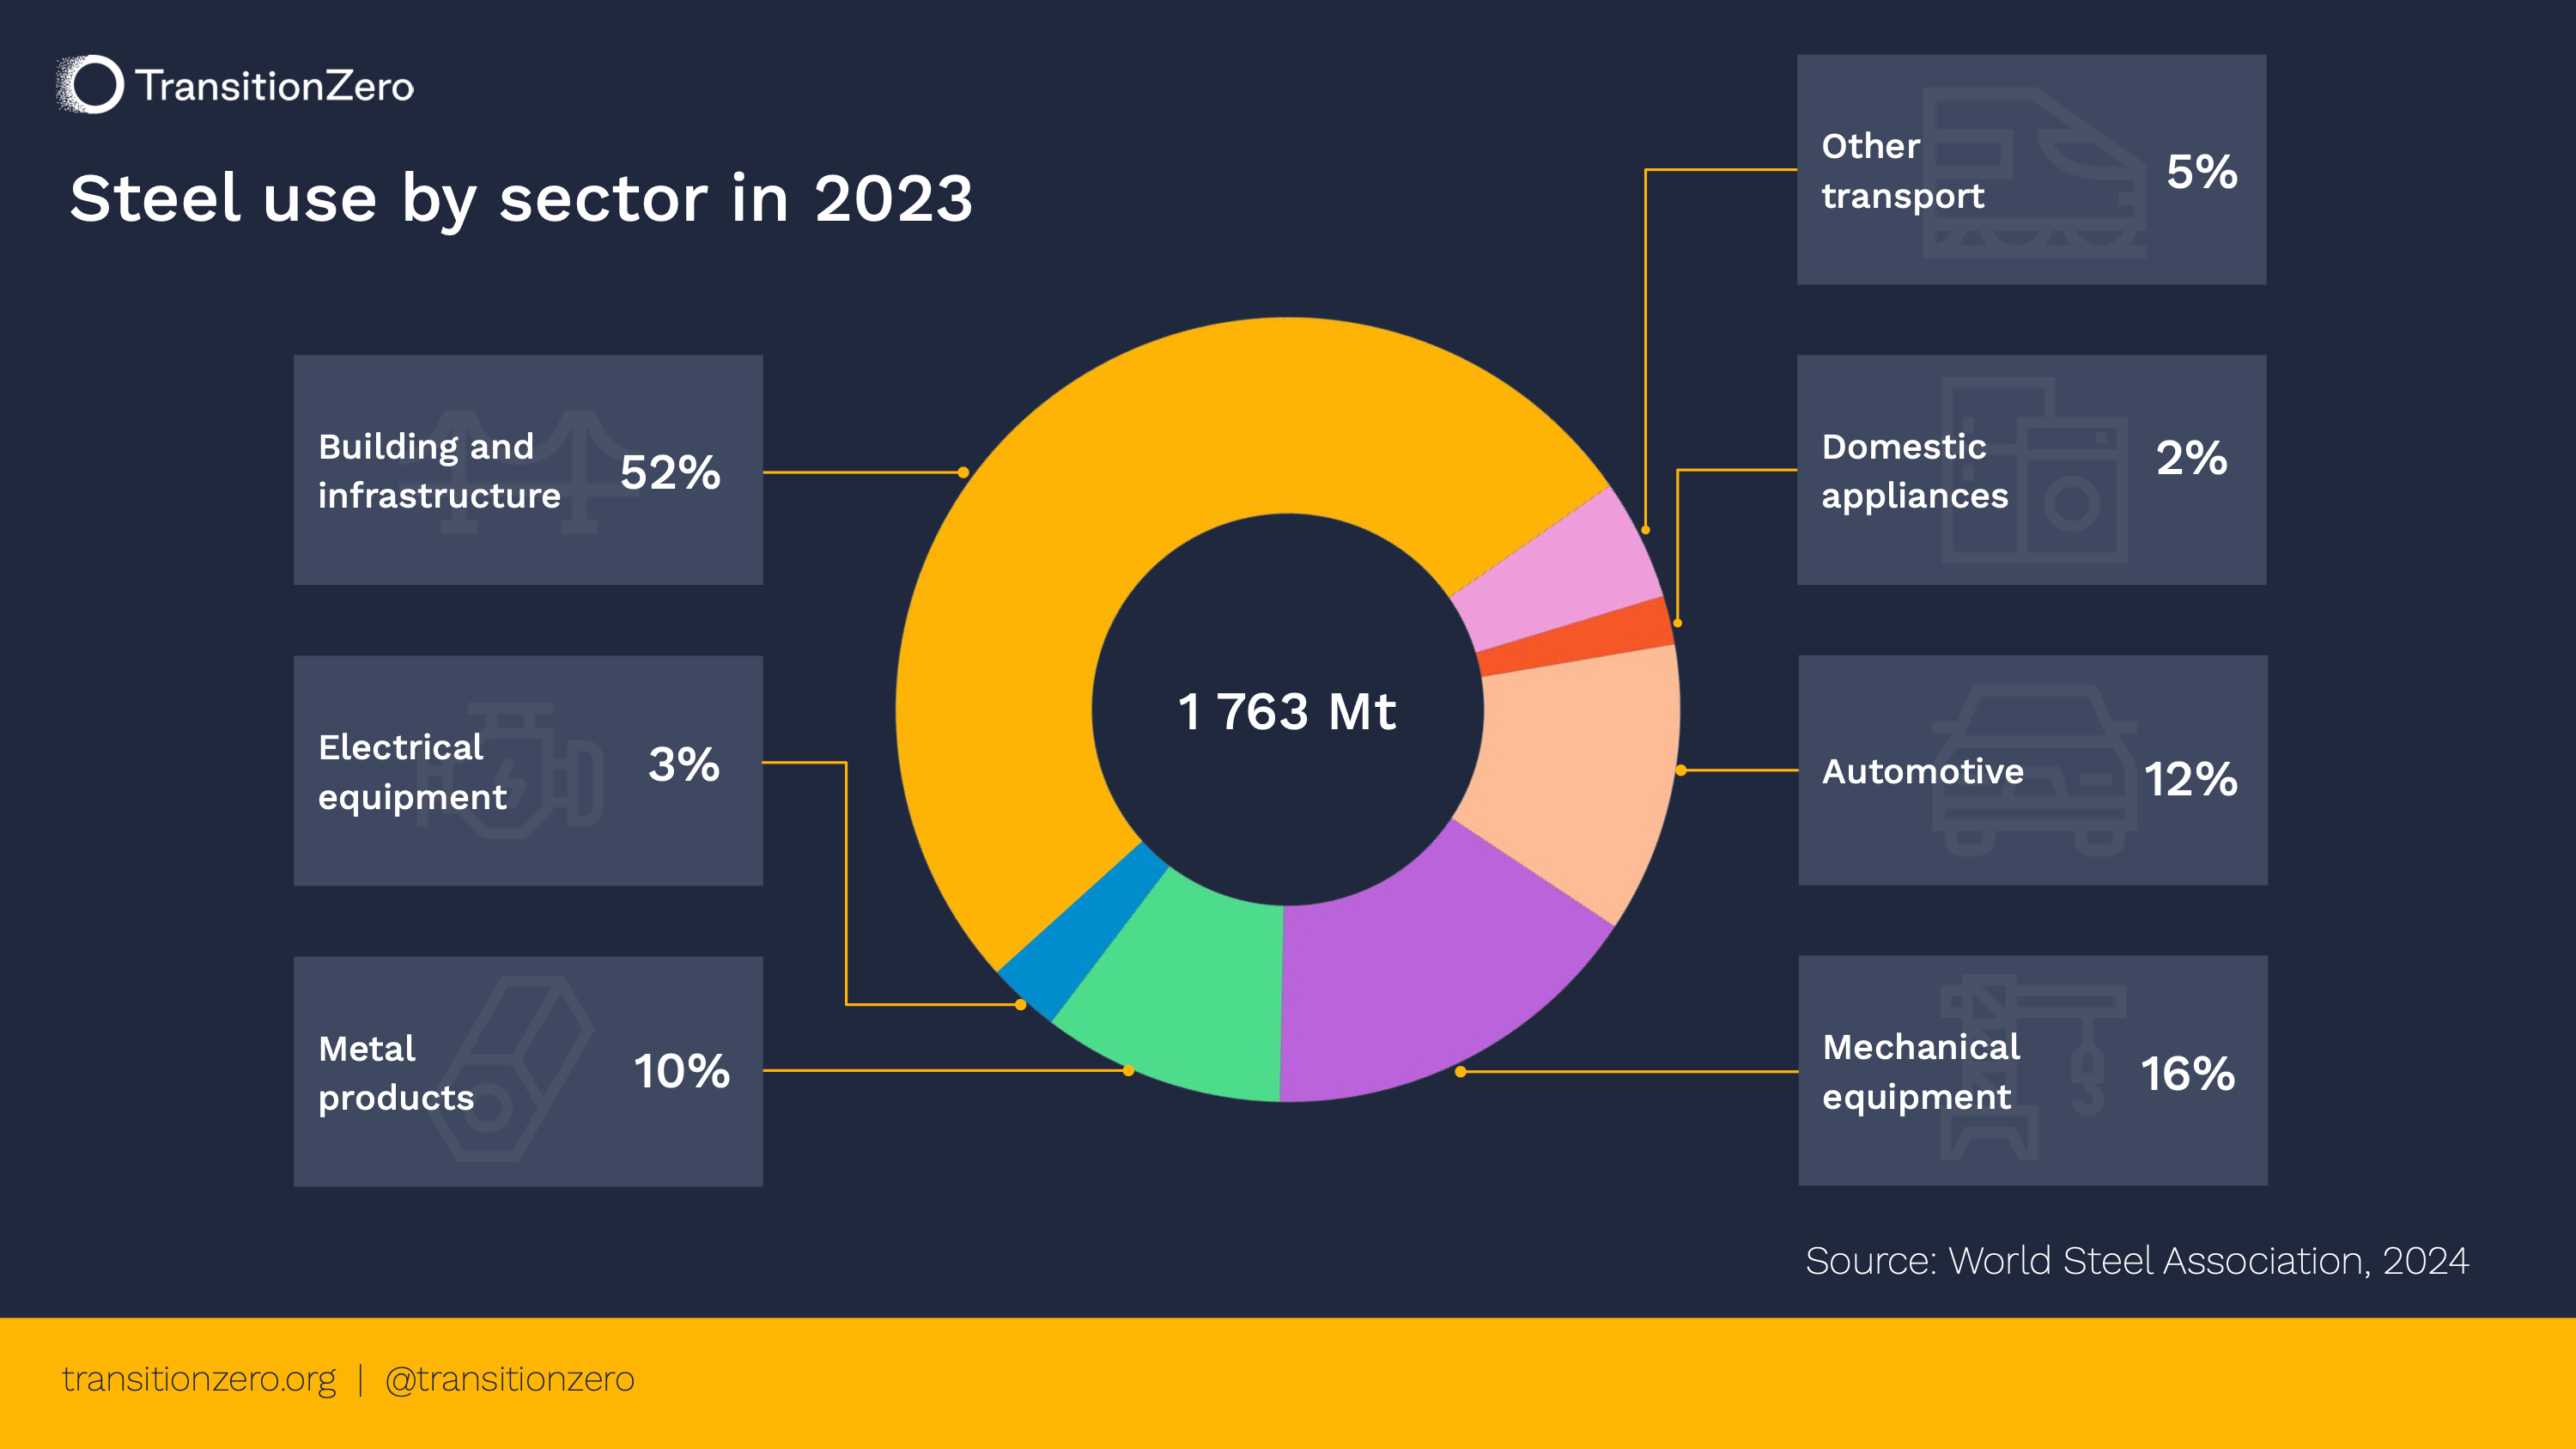
Source: World Steel Association, 2024
Satellites can plug data gaps
By 2050, emissions from the iron and steel sector must drop by 90%, according to the IEA’s net zero emissions (NZE) scenario. Unfortunately, a lack of accessible, accurate data makes it difficult to track the sector’s progress on emissions reduction, a problem plaguing all heavy industries. Alongside our coalition partners at Climate TRACE, we’re developing better methods to estimate emissions from these notoriously hard-to-abate sectors.
Today, we’re sharing our improved methodology for monitoring steel production, which helps us estimate both production and emissions at facility level.
We use satellite imagery to enhance and augment existing, open-access data for the steel industry.
The infrared sensors on the European Space Agency’s (ESA) Sentinel-2 and Landsat 8 satellites are used to identify hotspots, or areas with high levels of activity within a steel plant.
This approach is limited to Blast Furnace-Blast Oxygen Furnace (BF-BOF) facilities. While the industry is moving towards Electric Arc Furnaces (EAF), a technology using just one-eighth of the energy of a BF-BOF, the pace of change is glacial. BF-BOF still accounts for 71% of global crude steel production in 2023, a share that hasn’t changed in 10 years.
There are many types of ‘units’ within a BF-BOF facility; blast furnaces, coke ovens and sinter / pellet plants. These all operate at temperatures higher than 1200°C, hot enough to be captured by the infrared sensors of satellites.
Our methodology scours satellite imagery for heat signatures from the 345 operating steel plants tracked worldwide. Each steel production unit, once identified, is outlined with a hand-drawn polygon. The intensity of the hotspot above each unit helps us estimate both the plant’s production level and emissions.
Our global steel asset polygons dataset
Using Global Energy Monitor’s Global Steel Plant Tracker as a foundation, TransitionZero has built a global dataset of blast furnaces, coke oven batteries, sinters and pellet plants with the help of our satellite-based hotspot methodology. The 2024 dataset spans 40 countries and contains the location, shape, crude steel capacity and operation start year for 345 steel plants, and the location, shape, and type for 2,301 of their associated sub-assets.
Historical heat signatures are collected for each identified unit, with new data appended during subsequent satellite passes. This iterative process has helped us develop a more granular, asset-level database for estimating steel production and emissions than is currently available.
This dataset can supplement GEM’s Global Blast Furnace Tracker, which specifically tracks the capacity of blast furnaces, including the year these furnaces commenced production, and their current operating status. However, this dataset does not include the location of blast furnaces, nor does it include facility-level information about energy-intensive coke ovens, sinters or pellet plants.
Methodology limitations
There are many challenges to building an accurate and comprehensive data set for this sector. We’re still in the early stages and continue to refine this data.
In addition to the lack of ‘ground truth’ data from the sector itself, relying on satellite imagery means our methodology is impacted by the number of satellite passes over a facility, poor signal and persistent cloud cover. Image resolution in itself is a challenge. The open-source satellite data from ESA’s Sentinel-2 infrared sensors that we rely upon is only available at a spatial resolution of 20 metres.
Finally, the absence of facility-level production and emissions data makes it difficult to test the accuracy of our modelling linking hotspot data to production and emissions.
How can we use this data?
The methodology discussed today is already being used to estimate production and emissions for steel plants worldwide, and a new release of that emissions data will be published later this year through Climate TRACE. Climate TRACE began in 2019 when founding coalition members, WattTime and TransitionZero, received a Google.org grant to monitor power plant emissions from space using satellites. 2022’s emissions inventory, including the steel industry based on our previous methodology, can be accessed here.
Today, our steel sector emissions estimates are influencing decisions at the highest levels of industry; Tesla, Boeing and General Motors, are using our steel productivity and emissions data to inform supply chain decisions. As part of Climate TRACE, TransitionZero is responsible for heavy industry and power generation data. To learn more about our work, read this recent interview with Ashank Sinha.
